Full node monitoring
Introduction
This article is the reference material for developers, to consult about monitoring while operating their full nodes.
Monitoring tools
Hathor full node provides two main built-in monitoring alternatives:
- via HTTP API; and
- via Prometheus integration.
HTTP API
There are many endpoints exposed by Hathor full node HTTP API that can be used in monitoring activities. Among these, the most relevant for ongoing operations are:
GET /status API operation is particularly useful during deployment stage, offering details on whether the full node has completed initialization, is ready to receive API requests, how many peers it is connected with, etc. In turn, GET /health conducts a health check of the full node.
For more on these and all other endpoints, see Hathor full node HTTP API.
Prometheus integration
While one may use these endpoints to implement a polling solution, a better strategy for health check routine and overall observability is to use metrics with an off-the-shelf monitoring solution.
For this purpose, Hathor full node integrates with the Prometheus monitoring and alerting toolkit. As such, it generates metrics in Prometheus' text-based format, which can be exposed to Prometheus and compatible solutions. For the list of metrics that are generated by Hathor full node, see Hathor full node metrics.
Suggested solution
This section presents the suggested solution, based on Prometheus, for monitoring one or multiple Hathor full nodes. The following diagram presents the architecture of this solution:
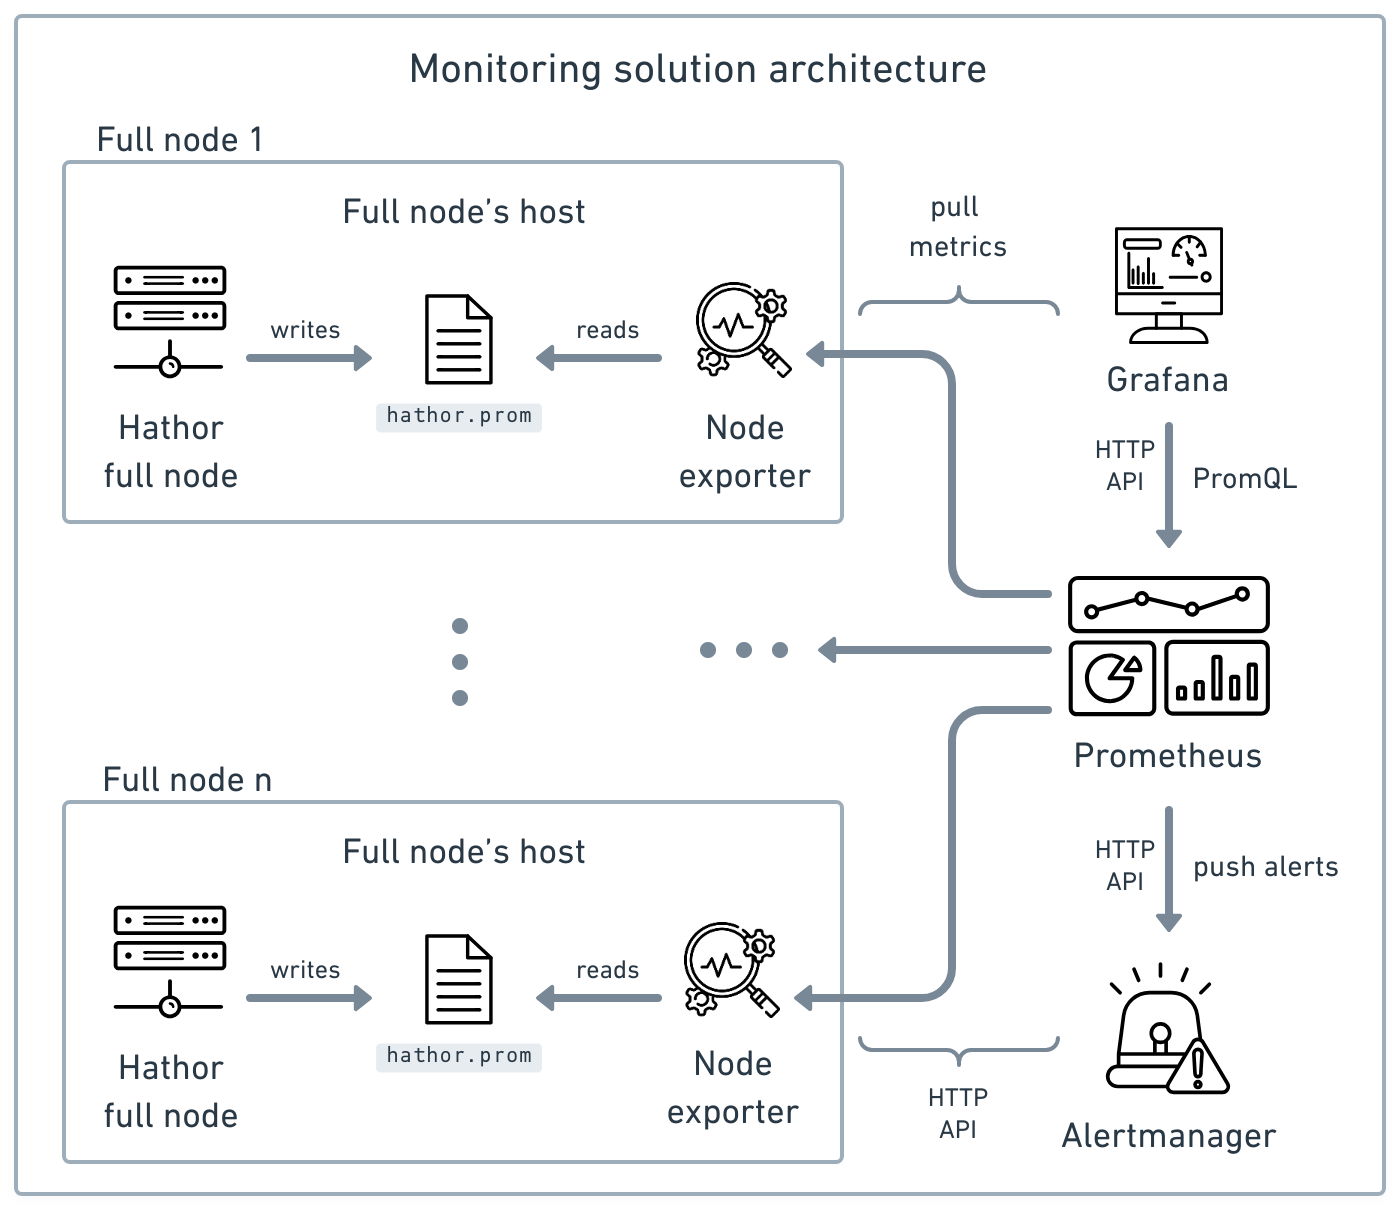
Credits: icons created by Ralph Schmitzer — The Noun Project, IYIKON — The Noun Project, Freepik — Flaticon, Junaid Ali — The Noun Project, Alexa Nguyen — The Noun Project, and krisna arga muria — The Noun Project.
The arrows denote the orientation of API requests. This architecture comprises five main components:
- Hathor full node(s) (multiple instances)
- Node exporter(s) (multiple instances)
- Prometheus
- Grafana
- Alertmanager
In the following subsections, we explain what each of these components is, their roles in the suggested solution, and how they interact. We conclude the section by discussing how to implement the solution.
Hathor full node
As already explained, Hathor full node generates metrics about its own execution in Prometheus' text-based format. It then writes these metrics to the hathor.prom file located within its database directory. This solution allows for the monitoring of multiple full node instances.
Node exporter
Node exporter is a service that collects metrics within the scope of its host, and exports them to Prometheus. As a result, each full node's host need to execute its own Node exporter instance.
This instance collects full node's metrics by reading the hathor.prom file, and collects machine-related metrics directly from the host — e.g., CPU usage, memory usage, disk usage, etc. Finally, it exposes these metrics to Prometheus. It exports these metrics at /metrics endpoint of its HTTP API, and by default listens to Prometheus requests on port 9100.
Prometheus
The Prometheus server is the central component of the suggested monitoring solution. It scrapes metrics from targets, stores them in its local database, and aggregates them into timeseries, enabling data analysis and alarms.
In the suggested solution, Prometheus scrapes metrics from each existent instance of Node exporter. It exposes all aggregated data through its HTTP API and listens on port 9090 by default. Grafana can then be used to visualize this data.
Additionally, Prometheus allows the definition of alarms. An alarm is a piece of configuration describing an undesirable condition and alerts issued in response to it. An alert is a notification message informing about a change of state, typically signifying a potential problem 1. Thus, Prometheus pushes alerts to Alertmanager.
Grafana
Grafana is an application used for data visualization through dashboards. It uses Prometheus as its data source by connecting to its HTTP API.
Hathor Labs provides a public dashboard already pre-configured for monitoring full nodes. This dashboard was conceived to facilitate day-to-day operation of full nodes.
Alertmanager
Alertmanager is a service that manages alerts sent by Prometheus, handling what, who, when, and how notifications are sent.
In the proposed solution, Alertmanager will be used to notify operators whenever any of their full nodes become (or are becoming) unhealthy. By default, it listens on port 9093. It receives alerts from Prometheus, manages them, and then dispatches notifications to various receivers.
It can dispatch notifications to a wide range of receivers, supporting SMTP, webhooks, and more, while integrating with various platforms such as Discord, Opsgenie, Slack, Telegram, and SNS.
Implementation
For how to implement the suggested solution see How to install a monitoring system for Hathor full node.
The primary reason for monitoring any system is to ensure its ongoing healthy operation. A system is considered healthy if it is functioning according to its expected behavior.
Therefore, in addition to having the means for monitoring, operators also need to understand what 'vital signs' should be monitored and use them to implement health checks for their full nodes.
Health checks
This section presents the set of health checks that should be implemented using the described Prometheus-based monitoring solution.
What is a healthy full node?
In Hathor, a full node is considered healthy if it meets the following criteria:
- It is well-connected to the network.
- It is synced with its peers.
- It is responsive to API requests from clients.
Being well connected to the network (1) means that the number of simultaneous connections a full node has with its peers varies only within a predefined range. This predefined range depends on the operational requirements of each full node, so there is no single baseline suitable for all scenarios. Each operator should define the appropriate baseline for each of their full nodes. For example, the ideal range of connections might be 5-10 for one peer in the network and 15-20 for another.
The following subsection explains how to use these three criteria to monitor the health of full nodes using the Prometheus-based monitoring solution described in this article.
Full node vital signs
The main vital signs to monitor the health of a full node during routine operation are:
- Number of simultaneous connections with peers
- Number of blocks of the best blockchain
- Number of transactions in the database
- CPU usage
- Memory usage
- Disk usage
Each of these six vital signs is tracked by a metric on Prometheus.
Number of simultaneous connections with peers
It is tracked by the connected_peers metric. This vital sign should be used to check if a full node is well-connected with the network. As previously explained, there is no unique baseline for it.
With that said, there are two benchmarks to assess whether a full node is well connected to the network. First, it should maintain a number of connections within the range defined by the operator over time. A progressive decline in the number of connections over time suggests that the full node is at risk of disconnecting from the network. Secondly, a full node should have a minimum of three simultaneous connections to be considered healthy.
It is advisable to define three levels of alarms for this vital sign in Prometheus:
- Level 1 — monitorable: if
connected_peersdrops below the baseline range within a given time frame. - Level 2 — high: if
connected_peersdrops below three within a given time frame. - Level 3 — critical: if
connected_peersdrops to zero within a given time frame.
Number of blocks of the best blockchain
It is tracked by the best_block_height metric. This vital sign is used alongside 'number of transactions in the database', to check if the full node is synced with its peers.
The average time between blocks in Hathor Network is 30 seconds. As a result, if the number of blocks in best blockchain does not increase within a given time frame, it means either:
- the full node is synced, but the network did not generate new blocks in the time frame; or
- the full node is not receiving the newly mined blocks because it is out of sync.
A third possibility is that the full node is synced with its peers, but they form an isolated cluster disconnected from the main network. Assuming the full node is well-connected to the network (i.e., it meets the first criterion of a healthy full node), this possibility can be discarded.
To differentiate between these two scenarios, it is necessary to analyze it alongside the number of transactions in the database. As a result, it is advisable to define three alarms on Prometheus using best_block_height and transactions metrics to trigger if the full node becomes out of sync:
- Level 1 — high: full node out of sync for more than 10 min.
- Level 2 — urgent: full node out of sync for more than 20 min.
- Level 3 — critical: full node out of sync for more than 30 min.
Number of transactions in the database
It is tracked by the transactions metric. This vital sign should be used alongside "number of blocks of the best blockchain" as explained in the previous subsection.
CPU usage
It is tracked by the cpu metric, which indicates the CPU usage of the full node's host. High CPU or memory usage are common causes of health issues in full nodes. A full node that is constantly operating on the limit of its CPU or memory capacity may become unresponsive to API requests from clients, unable to sync with the network, and may even fail to maintain established connections with its peers.
It is advisable to define three levels of alarms for this vital sign in Prometheus:
- Level 1 — monitorable: if
cpurises above 80% within a given time frame. - Level 2 — high: if
cpurises above 90% within a given time frame. - Level 3 — critical: if
cpurises above 95% within a given time frame.
Memory usage
It is tracked by the meminfo metric, which indicates the memory usage of the full node's host. This vital sign should be used alongside "cpu usage" as explained in the previous subsection.
It is advisable to define three levels of alarms for this vital sign in Prometheus:
- Level 1 — monitorable: if
meminforises above 80% within a given time frame. - Level 2 — high: if
meminforises above 90% within a given time frame. - Level 3 — critical: if
meminforises above 95% within a given time frame.
Disk usage
It is tracked by the filesystem metric, which indicates the disk usage of the full node's host. It is complementary to CPU and memory usage. As the blockchain size grows over time, a full node with insufficient disk space will become unable to stay synced with the network. Since disk usage increases gradually, monitoring this vital sign enables operators to anticipate and take necessary actions to prevent an unhealthy state.
It is advisable to define three levels of alarms for this vital sign in Prometheus:
- Level 1 — early indicator: if
filesystemusage exceeds 80%. - Level 2 — high: if
filesystemusage exceeds 90%. - Level 3 — critical: if
filesystemusage exceeds 95%.
What's next?
-
Metrics: reference material regarding metrics tracked by Hathor core.
-
Install a monitoring system: step-by-step to install a Prometheus-based monitoring system.
-
Monitoring system — PoC: example of a Prometheus-based monitoring solution.
-
Full node pathway: for how to operate a full node.